
Key takeaways
Dubai’s Q3 market in four points.
- One average no longer describes Dubai. Knight Frank reported prime values 10.9% higher in the year to June, while ValuStrat’s broad residential index was 3.1% lower year on year in August. The indices cover different segments and use different methodologies.
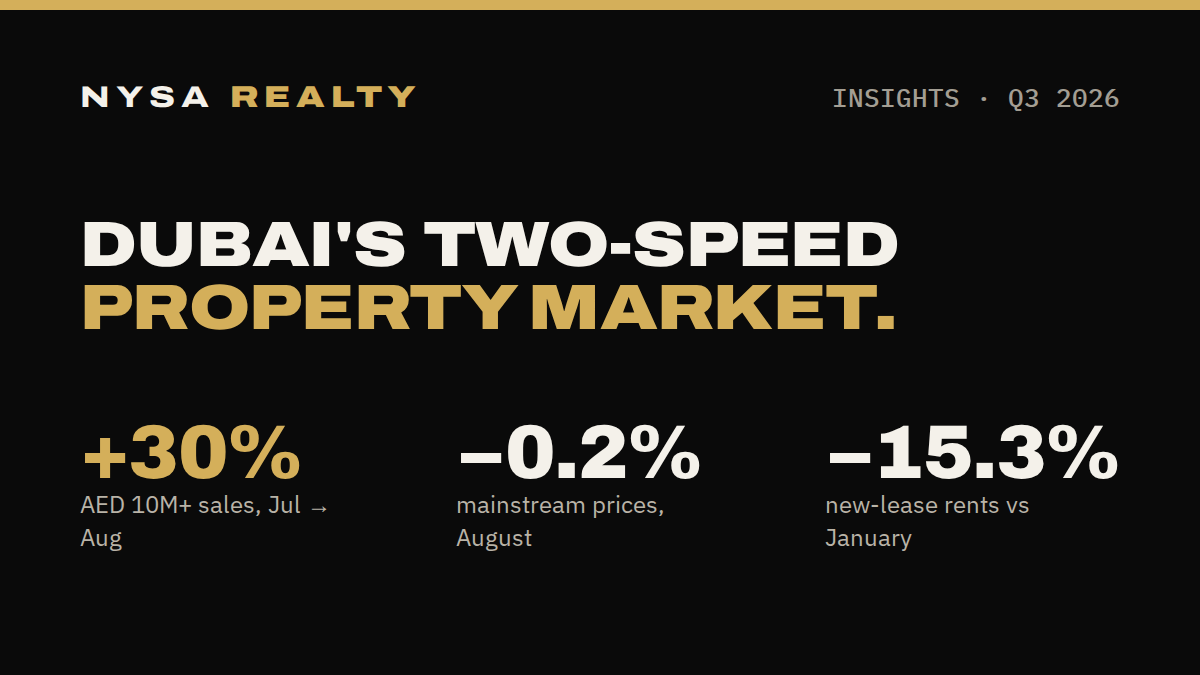
- The broad-market correction slowed sharply. ValuStrat recorded a 5.9% monthly fall in March and a 0.2% fall in August. That does not confirm a floor, but it changes the case for waiting for another abrupt citywide decline.
- Ready homes offered a lower registered entry price than off-plan in July. Projectory’s DLD-derived medians were AED 1,341 per sq ft for ready homes and AED 1,731 for off-plan. A like-for-like comparison is still required before calling one unit cheaper.
- Tenants gained leverage. New leases exceeded renewals in July and August, while new-lease rents were reported 15.3% below January levels. Landlords and income investors should underwrite against current new-lease evidence.
Dubai is not moving as one market. Prime values and high-ticket registrations remain firm, while the wider residential market has absorbed a correction and tenants have gained negotiating leverage. The opportunity is now in selecting the right segment, building and entry price—not following a citywide headline.
Evidence period: July–August 2026 for the Q3 monthly comparisons, with Q1 and H1 data used for context. Full Q3 figures were not available at the evidence cutoff of 21 September 2026.
Dubai did not stop in the third quarter of 2026. It separated. The upper end recorded more high-value sales in August than in July, while mainstream residential values adjusted to a lower level after March’s shock. Tenants also found more room to move, with new contracts outnumbering renewals.
For investors, the practical question is no longer whether “Dubai property” is rising or falling. It is which segment they are entering, how the specific unit compares with recent registered evidence, and whether the expected return compensates for supply, delivery and exit risk.
How the market arrived here
The comparison base is unusually strong. Dubai’s total real-estate transactions exceeded AED 917 billion in 2025, according to the Dubai Government’s Public Debt Management Office. The Dubai Land Department then reported AED 252 billion of transactions in Q1 2026, 31% higher in value year on year, with 29,312 new investors.
Those government totals cover a wider real-estate universe than the residential-home series used later in this article. They establish the scale of activity; they should not be compared directly with home-sale counts from narrower datasets.
By H1, residential activity had become more selective. Projectory’s defined DLD-derived residential scope recorded 79,698 sales worth AED 227.1 billion. Against the same classification for H1 2025, sales were 14.3% lower: off-plan activity rose 3.9%, while ready-property sales fell 40.0%. Other providers publish different totals because their classifications differ.
Why the headline must be split
Knight Frank’s Prime Global Cities Index placed Dubai third in Q2 2026, with prime residential values 10.9% higher in the year to June. ValuStrat’s broader Dubai residential index was 3.1% lower year on year by August; apartments were down 5.3% and villas 1.7%.
These are not like-for-like indices. Knight Frank tracks prime homes; ValuStrat covers a wider residential basket. Read together, they show why a single Dubai average is no longer sufficient.
Registered sales point in the same direction. Projectory’s DLD-derived home series shows sales above AED 10 million increasing from 149 in July to 193 in August, while sales above AED 5 million increased from 437 to 565. Total home sales fell 11.5% over the same month.
Investor implication: compare performance at the level of the property type, price band, community and building. A buyer in JVC and a buyer on Palm Jumeirah are not operating in the same market.
The correction is losing speed
Most of the broad-market adjustment occurred earlier in the year. ValuStrat’s 5.9% monthly fall in March slowed to 1.9% in April and 0.2% in August. Cavendish Maxwell separately reported an average residential price of AED 1,636 per sq ft in August, 1.7% lower than a year earlier—the first annual decline in its series since February 2021.
A slower decline does not establish a market floor. It does mean that a buyer waiting for another abrupt citywide fall is relying on a pattern the latest monthly reading no longer shows. Confirmation would require several consistent monthly observations, not one near-flat result.
Ready versus off-plan: the category gap is a starting point
Off-plan remained dominant, accounting for 73.6% of Projectory’s home-sale series in July and 74.2% in August. July’s registered medians nevertheless showed a wide price-per-square-foot gap: AED 1,341 for ready homes and AED 1,731 for off-plan homes.
The arithmetic gap is 22.5%, but it is not an automatic discount on equivalent property. Location, unit size, building age, specification, incentives and payment plans all influence the two citywide medians. The useful next step is a same-community, same-unit comparison.
Ready-home registrations rose 21.5% month on month in July as off-plan registrations fell 3.6%. A ready unit may offer immediate rent, observable building performance and mortgage valuation today. An off-plan purchase may offer staged payments and exposure to future area maturation. Each advantage has a price.
Compare the unit, not the label. Place ready and off-plan options side by side using purchase price, incentives, financing, service charges, expected rent, handover timing, foregone income and realistic resale liquidity.
The rental market has turned in tenants’ favour
According to fäm Properties’ analysis of Dubai Land Department tenancy registrations, new leases exceeded renewals by 633 contracts in July and 2,139 in August—the first months in its dataset, which begins in January 2023, when new leases moved ahead.
New-lease rents were reported 15.3% below January, while renewal rents had eased by about 1%. The median new apartment lease was AED 94.6 per sq ft in August, 8.3% below its October 2025 peak.
Tenants now have comparable evidence to use at renewal. Landlords should weigh a fair renewal against vacancy, marketing and re-letting costs. Investors should model income from current new-lease evidence for the specific building—not last year’s renewal or an advertised asking rent.
Supply: heavy now, potentially thinner later
Savills reported that Q2 2026 produced the highest quarterly delivery of new Dubai homes in recent years, while new launches slowed from more than 45,000 units in Q1 to 5,335 in Q2.
The immediate implication is more competing stock in areas receiving concentrated handovers. If the launch slowdown persists, it could reduce the pipeline in future delivery years. One quiet launch quarter does not remove the large stock already under construction.
Supply must be tested at community and property-type level. A citywide completion number cannot tell an investor how many directly competing apartments, family villas or branded units will reach their chosen micro-market.
Match the data to your position
Where NYSA fits
NYSA evaluates opportunities against evidence for the specific building, community and investor objective. In this market, that means testing whether the asking price reflects the 2026 adjustment, whether rental assumptions use current new leases, and whether an off-plan handover competes with a concentrated supply wave.
Move from the headline to the property. Compare the specific building, entry price, funding route and exit risk before acting.
Speak with a NYSA advisorBuild your investor profile with NIA
Final thought
Q3 2026 has not produced one Dubai property story. Prime and high-value activity remained firm, the broad market absorbed a correction that was losing speed by August, and tenants gained leverage. Opportunity sits in the differences between these segments—and becomes visible only when the evidence is narrowed to the property an investor is actually considering.
Frequently asked questions
Are Dubai property prices still falling in Q3 2026?
ValuStrat’s broad residential index was lower in August, but the monthly decline slowed to 0.2% from 5.9% in March. Prime values followed a different path. The answer depends on segment and methodology.
Is ready property cheaper than off-plan in Dubai?
July’s DLD-derived medians were AED 1,341 per sq ft for ready homes and AED 1,731 for off-plan. The gap describes different transaction mixes and does not prove equivalent ready units are always cheaper.
Why are new leases outnumbering renewals?
New-lease rents were reported 15.3% below January levels while renewal rents had eased by about 1%, giving some tenants a reason to move.
What does the fall in new launches mean?
Near-term handovers can pressure competing stock; a sustained launch slowdown could reduce later supply. Neither effect will be uniform across communities.
Does this article contain complete Q3 2026 data?
No. Its Q3 monthly comparisons cover July and August. The complete quarter should be reassessed after September data is finalised.
Sources
- Dubai Government Public Debt Management Office.
- Dubai Land Department, Q1 2026.
- Knight Frank, The Residence Report 2026.
- ValuStrat VPI, March 2026 and ValuStrat August 2026 review.
- Projectory July 2026 report.
- Projectory August 2026 report.
- fäm Properties tenancy analysis.
- Savills Q2 launch and completion data.
This article is for general information only and does not constitute financial, legal or property advice. Different providers apply different property classifications and index methodologies. Registered values, medians and valuation indices are not interchangeable.